Recommendation 1
Melissa Pittard (chair), Rachel Saidi, Anna Bargagliotti, Chris Malone
Teach statistics and data science as iterative processes of gleaning insights from data to inform evidence-based decisions.
The following diagram provides a visual of the process of working with data that students in an introductory class should engage in:
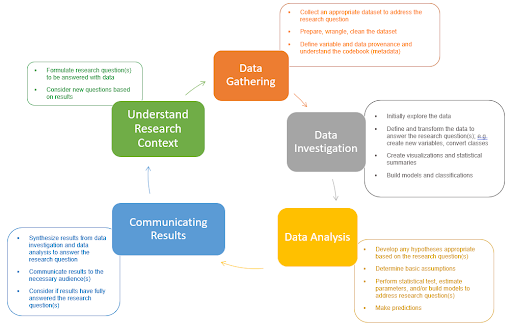
Viewing statistics as an iterative process making heavy use of questioning and interrogation of the data is not a new idea (see Lee et al. (2022) for a description of the numerous models of the practice of statistics). For example, Wild and Pfannkuch (1999) present the Problem, Plan, Data, Analysis, Conclusions (PPDAC) model that describes how doing statistics means engaging in a process. The GAISE II K-12 Report (Bargagliotti 2020) also presents the Problem Solving Process, a four-component process that includes Formulating a Question, Collecting or Considering data, Analyzing data, and Interpreting Results. Introductory statistics should convey the seamless integration of statistical methods and the scientific method, how visualizations inform inferential statistical methods, and how inferential statistical methods can lead to new related questions–all through engaging in the process of working with data. Liberal use of examples drawn from real datasets is essential; see Recommendation 4.
The information ecosystem has shifted to a world of consumers and producers of data. This data is used in all aspects of society, such as news and journalism, business and advertising, and policy and healthcare, to name a few fields. Because data is in every facet of our lives, it is important for students to engage in the process of making decisions with data by engaging in the process pictured above. An introductory statistics course can leverage students’ innate curiosity and interests to learn more about their world and become more discerning consumers of statistics and data. Students should learn about the iterative nature of how data is collected, what kinds of variables are in question, how to derive questions, how to create visualizations, numerical summaries, and how to perform reproducible inferential statistical procedures to develop insights.
Additional Resources
Examples
Assessments