Recommendation 3
Nick Horton (chair), Rebecca Wong, Ulrike Genschel, Laura Ziegler, Joe Roith, Lisa Kay
Emphasize effective written and oral communication of results from data, with attention to the scope and limitations of conclusions.
Introduction: Conceptual vs. Procedural Knowledge
Given the limited time we can devote to instruction, it is essential to prioritize the ideas that we choose to ask our students to engage with. Focusing on conceptual understanding rather than procedural knowledge is fundamental to understanding how and why statistics works.
Focusing on conceptual understanding changes the presentation of topics in the classroom and the types of questions we ask in the classroom and in assessments. We present examples of how conceptual understanding might be centered when presenting two topics from the introductory statistics course: (1) the sample standard deviation and (2) the use of the Empirical Rule.
Conceptual understanding of the standard deviation
One example is understanding the use of the sample standard deviation. Traditionally, instructors might have introduced the standard deviation by providing its formula and asking students to calculate its value for a small sample of observations numerically. This approach focuses on algebraic and procedural skills and may take away from the larger role the standard deviation plays.
An approach focusing more on conceptual understanding and interpretation that might be more effective. We provide two examples:
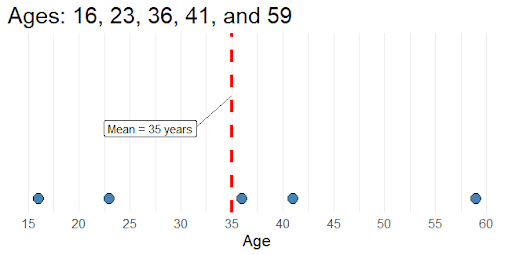
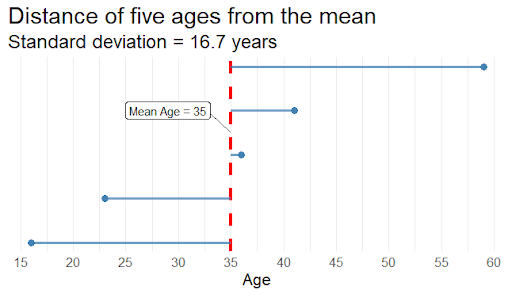
- An instructor displays the ages of 5 people on a dot plot with the sample mean marked on the graph. Students are asked, on average, how far are the five ages from the mean age. A discussion about the deviations from the mean is used to describe the standard deviation informally.
The traditional approach to calculating the sample standard deviation is substantially procedural and may contribute little, if any, towards students’ conceptual understanding.
The following example demonstrates one purpose of the standard deviation and will assist students in understanding how to interpret it. Instructors may still show the formula in the second scenario, but instead of plugging the numbers into the formula, students can use technology to compute the standard deviation or simply interpret a provided standard deviation value.
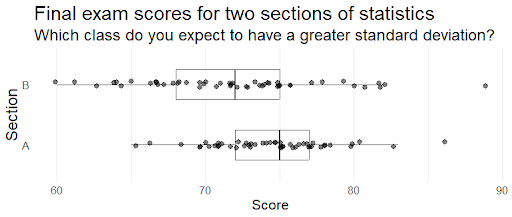
Students are given two boxplots, each displaying the final exam scores of all students in two different sections of the same course. Students are asked which section they would expect to have a greater standard deviation and what this might imply practically for an instructor teaching both sections.
Conceptual understanding of the Empirical (68/95/99.7) Rule
Another example is understanding the use of the Empirical Rule. A traditional approach would focus on providing students with the mean and standard deviation of a unimodal symmetric distribution and asking students to compute percentages of the distribution that would fall into various regions. For example, “Scores on a standardized test have a unimodal and symmetric distribution, with a mean of 80 and a standard deviation of 4. What percent of students would we expect to score above 84 on this test?”
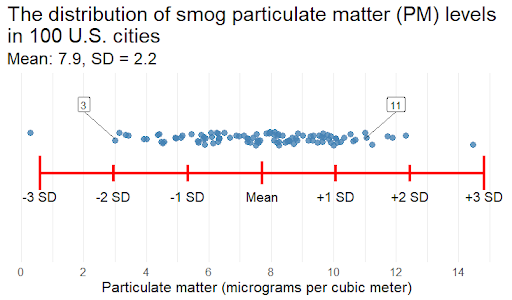
Rather than using the Empirical Rule as a tool for computation, a conceptual approach might focus on using the Empirical Rule as a guideline to determine what results could be considered unusual. Smog levels in cities are measured by levels of particulate matter (PM). The distribution of PM in U.S. cities is approximately unimodal and symmetric, with a mean of 7.9 micrograms per cubic meter and a standard deviation of 2.2 micrograms per cubic meter.
- Would it be unusual for a city to have a PM reading of 11? Why or why not?
- Which would be more unusual: a PM reading of 3 or a PM reading of 11?
- Explain and discuss.
From a statistical perspective, we see little pedagogical value in numerically calculating statistics such as a standard deviation or correlation coefficient by hand. Leveraging and demonstrating the computing tools that implement these formulas can have value and may be considered a special case of Recommendation 6.
Leveraging Technology
Technology is ubiquitous, and trained statisticians rely exclusively on computing. While not every student may have access to technology tools, most do, and it is reasonable to expect that instructors will have access to them. Thus, there is no functional reason for students to practice manual calculations of complex statistical formulas. Consequently, we suggest that manual formulas, algebraic manipulations, and the use of distribution tables are not a priority for an introductory statistics course and should be de-emphasized.
An introductory course will naturally include some computation, and while mathematical language offers a concise way to express key ideas, instructors should introduce only those formulas that enhance conceptual understanding, minimize computations that lack meaningful context, and utilize technology to simplify calculations and analysis.
In addition to using technology for computational purposes, visualization using technology is an effective way to illustrate concepts. Whenever possible, visual demonstration should be used: for example, visualizing the effect of changing sample size when calculating standard error for the difference in two means. This allows the instructor to touch on the mathematical effects while also keeping the focus on interpreting the data in context. Web applets (e.g., Rossman/Chance, ISI, StatPREP Little Apps, and the Art of Stat) can help students explore conceptual understanding without having to memorize or use formulas.
Additional pedagogical notes
It is important to recognize that procedural knowledge can work in tandem with conceptual knowledge to strengthen one another (Hurrell, 2021). Procedural knowledge in an introductory statistics course that enhances understanding of concepts should emphasize the statistical process. An example of this includes but is not limited to formulating/recognizing a specific question to be answered using data, identifying variable roles (response/explanatory), determining variable type (quantitative/categorical), exploring relationships through visualizations and summarizations, performing appropriate inferential techniques, and writing interpretations in the context of the original data and question. This approach also better connects the statistical process from one inferential technique to another compared with drawing connections from one formula to another.
Focus on procedural steps, especially with regard to algebraic manipulation and formulas, too often claims students’ attention that an effective teacher could otherwise direct toward concepts. An example of this approach may involve providing students with summary statistics and asking them to manually calculate the test statistic and determine the p-value using a t-table. Many students see the calculation of test statistics and using tables to find p-values as the goal, thus undervaluing or completely ignoring the context and purpose of the original question.
Students with a sound conceptual foundation from an introductory course should be able to understand statistics presented in the real world and be well prepared to study additional statistical techniques in a second course. While emphasis may not be placed directly on technical steps, conceptual knowledge gains can lead to procedural knowledge (Rittle-Johnson, Siegler, and Alibali 2001). By emphasizing concepts and good statistical practices, students will be better adapted to handle new statistical situations outside of the classroom.
Suggestions for teachers
- View the primary goal as to discover and apply concepts.
- Focus on students’ understanding of key concepts, illustrated by a few techniques, rather than covering a multitude of techniques with minimal focus on underlying ideas.
- Pare down the content of an introductory course to focus on core concepts in more depth.
- Perform most computations using technology to allow greater emphasis on understanding concepts and interpreting results.
- Although the language of mathematics provides a compact expression of key ideas, use formulas that enhance the understanding of concepts and avoid computations that are divorced from understanding.
- Use visual methods when demonstrating concepts instead of mathematical methods whenever possible.
Additional Resources
Examples